Selecting a Vial Container Closure System with the DeltaCube™ Modeling Platform
The pharmaceutical and biotech industries face many challenges when selecting the appropriate stopper, seal, and vial combination for a drug product. Further compounding these challenges is the manufacturing capability of each component supplier. Lot to lot variation can result in components that had maintained container closure integrity (CCI) and visual acceptance during development unexpectedly failing during production. Therefore, it is important to take a system approach when selecting vial container closure system (CCS) components and designing a fill-finish process. To minimize the risk for sterility failure and maximize performance, it is essential to understand not just the process, but also the historical and trending performance of the selected parenteral packaging components. As a result, West has built the DeltaCube™ Modeling Platform to facilitate data-driven selection and optimization of vial CCS components.
![]()
A common way to assess initial fit when selecting components is through stacking analyses. Sometimes this is referred to as a stack-up, stack-tolerance, or vertical stacking analysis. Using component drawing dimensional tolerances, the largest and smallest amount of aluminum from the seal which is available for crimping is computed. The amount of aluminum available for crimping is called the seal skirt overhang length (SSOL) and gives process development engineers an indication for the range of conditions the capper needs to accommodate. However, the SSOL must be taken within context, as vials have a finite amount of space under the crown.
Based on the dimensions in ISO 8362, 13mm 2R, 3R, and 4R vials have between 1.1 and 1.4mm of available space to crimp aluminum onto, while 20mm 6R, 8R, 10R, and 15R vials have between 1.6 and 1.9mm. Exceeding the available neck to crown distance results in crimping onto the neck, which typically manifests as a fold in the metal near the neck. This is generally regarded as a visual defect and results in rejected product. In extreme cases, the crimping mechanism can break the glass vial as the disc or roller strikes the neck.
Understanding these concerns and the need for a systems approach to selecting optimal vial CCS components, West has developed the DeltaCube™ Modeling Platform. Using West’s own quality data as well as user imported data, the application computes for any desired stopper compression, the probability distribution describing the amount of aluminum available to crimp for any vial CCS. Then, using either a user supplied SSOL range, or West’s recommended limits, the application computes P(Incorrect Assembly), which describes the percentage of possible cases which do not meet the SSOL requirements. The DeltaCube™ Modeling Platform can rapidly compare up to four CCSs at one time.
In order to understand the utility of the DeltaCube™ Modeling Platform, the following is an example for how to evaluate four different 13mm vial CCSs with the application. Each CCS contains the same stopper and seal. However, while the vial in each CCS has similar crown statistics, they have very different underlying statistical distributions despite meeting ISO 8362 specifications. We will use these four CCSs to illustrate:
1. The risks of assuming all components with the same specification are equal.
2. How to select a CCS using the DeltaCube™ Modeling Platform.
3. How to identify initial compression targets for process development.
The first step in evaluating a CCS using the DeltaCube™ Modeling Platform is to examine the summary statistics for each component. Table 1 below shows the average and standard deviation based on all available data for the four CCS we are investigating. Each vial distribution is named according to its shape. Normal represents a typical bell-curve, Large represents a large skewing dimensional distribution, Small represents a small skewing distribution, and Extreme represents the case where exactly 50% of the data exists at each end of the specification. An initial assessment using just the summary data would suggest that each of the vials should be approximately the same, but a deeper examination will show that is not the case.
| | Vial Crown Height Distribution | Stopper Flange Thickness | Seal Skirt Length |
| Normal | Large | Small | Extreme |
| Average (mm) | 3.61 | 3.66 | 3.56 | 3.60 | 2.057 | 6.308 |
Standard Deviation (mm) | 0.08 | 0.12 | 0.12 | 0.20 | 0.075 | 0.022 |
Table 1: Summary statistics for the components investigated. All dimensions are in mm.
With the DeltaCube™ Modeling Platform we can examine the underlying statistical distributions to truly determine whether components are the same or different. This feature is especially helpful when challenging the assumption that the components follow a normal distribution. It can also assist when sourcing components from multiple vendors, as in the case of glass vials which are sometimes used interchangeably. The same ISO vials from different vendors may have different underlying statistical distributions, which can be rapidly assessed using the DeltaCube™ Modeling Platform when this data is uploaded. Figure 1 illustrates the underlying statistical distributions for the stopper and seal used in each of the four CCSs, while Figure 2 shows the individual vial distributions.
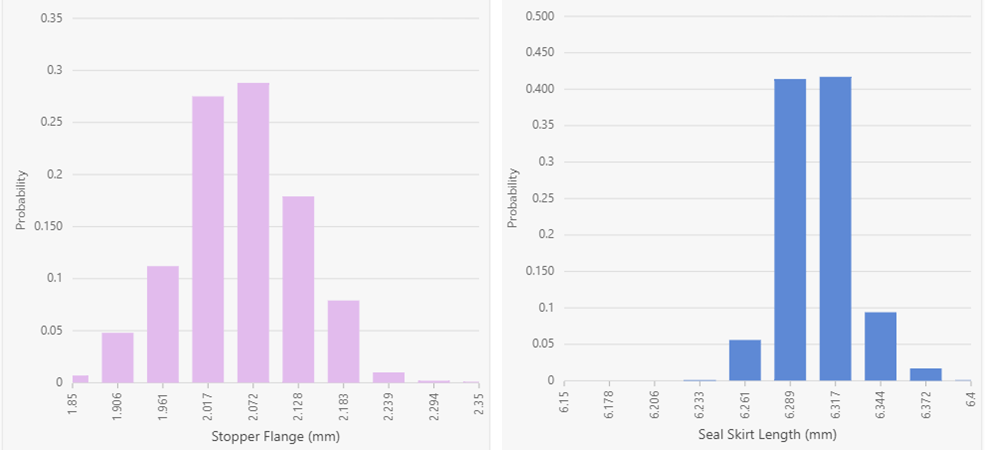
Figure 1: Underlying statistical distributions for the stopper (left) and seal (right). Results are displayed in a histogram format using 10 bars.
As shown in Figure 1, the stopper and seal data appear normally distributed. Within the DeltaCube™ Modeling Platform, component statistical distributions are displayed based on engineering specifications with the real data summarized into a histogram format. As a result, the middle of each histogram is generally the nominal value. This results in a slightly different interpretation of the graphs, suggesting that the stopper is in fact shifted slightly to the left and thus smaller than anticipated, while the seal is shifted to the right and larger than anticipated. Turning the focus to the vials, Figure 2 shows the underlying statistical distributions for the four cases investigated.
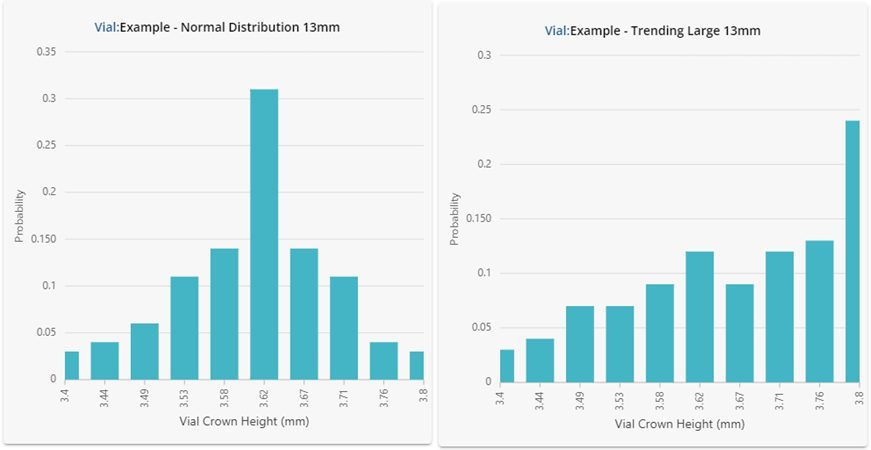
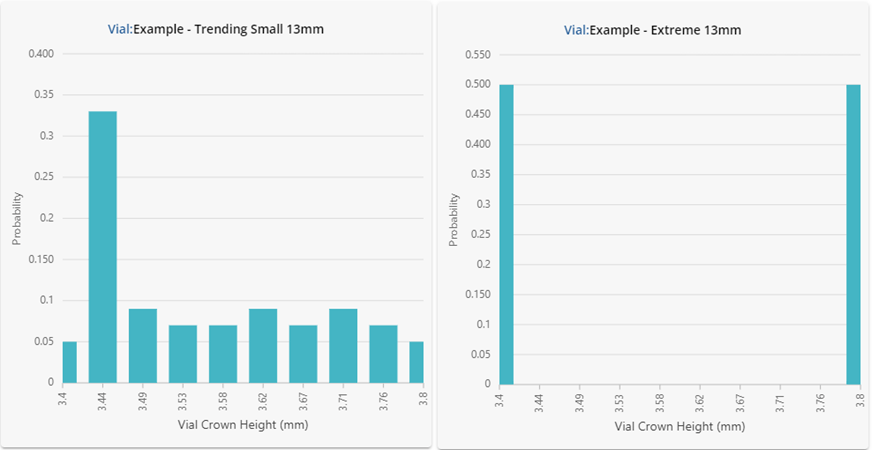
Figure 2: Underlying statistical distributions for the vials investigated. Results are shown in a histogram format using 10 bars.
Despite having similar summary statistics, the dimensional performance for each of the vials in Figure 2 is clearly very different! One should not expect the performance in fill-finish processes to be similar either. The vial data shown here was intentionally generated to showcase how different the underlying distributions can be despite displaying similar summary statistics. If this data were representative of four different vial vendors supplying the same ISO specification vial, substituting each into the same process could lead to significant problems.
Using the comprehensive stack-up analyses performed by the DeltaCube™ Modeling Platform, it is possible to investigate what compression range should produce the best results. Each CCS was evaluated based on the West generally recommended overhang length range of 0.5 to 1.3mm, over the compression range 20 to 45%. At each compression value, P(Incorrect Assembly) was computed which calculates how much of the available real data falls outside the specified limits as shown in Table 2.
| P(Incorrect Assembly) |
| | CCS |
| Compression(%) | Normal | Large | Small | Extreme |
| 20 | 0.04 | 0.25 | 0.07 | 0.61 |
| 25 | 0.01 | 0.01 | 0.02 | 0.2 |
| 30 | 0.31 | 0.38 | 1.08 | 5.37 |
| 35 | 4.66 | 5.35 | 18.49 | 36.95 |
| 40 | 21.26 | 18.65 | 50.29 | 49.86 |
| 45 | 67.95 | 43.81 | 72.97 | 50.03 |
Table 2: P(Incorrect Assembly) values for each CCS, labelled according to which vial was used. All values are shown as percentages.
When considering Table 2, it becomes clear that the anticipated performance of each CCS is different at each compression value. For applications requiring 20-25% compression of the rubber stopper, each of the four CCSs should perform reasonably well. However, upon reaching 30% to 35% compression, the CCSs using the small skewing and the extreme vial crowns become poor choices as they present significantly more risk than the other two CCSs. Above 35% compression, none of the four CCSs investigated appear suitable and should not be used.
West also provides support through testing services such as dimensional analysis, packaging material characterization, engineering fill-finish capabilities evaluation, residual seal force testing, and container closure integrity testing, to name a few. For more information on the DeltaCube™ Modeling Platform, please click here.
Register today for our webinar next week that will focus on the DeltaCube™ Modeling Platform.
DeltaCube is a trademark of West Pharmaceutical Services, Inc., in the United States and other jurisdictions.