What’s in the Box? A Case Study to Understand the Data Needed to Make an Informed Decision to Select Your Vial Containment System
When evaluating the vial system for your drug product, how do you know you’re making good decisions about protecting the drug product while also meeting regulatory expectations for data requirements as outlined in ICH Q9? To illustrate how complex it is to determine how much data is enough to make good, sound, decisions on your vial containment system, two 20mm container closure systems (CCS) were evaluated with the primary difference being the hardness of the rubber vial stopper. The designs were identical for each stopper, meaning the specifications, nominal dimensions, and other major features were the same.

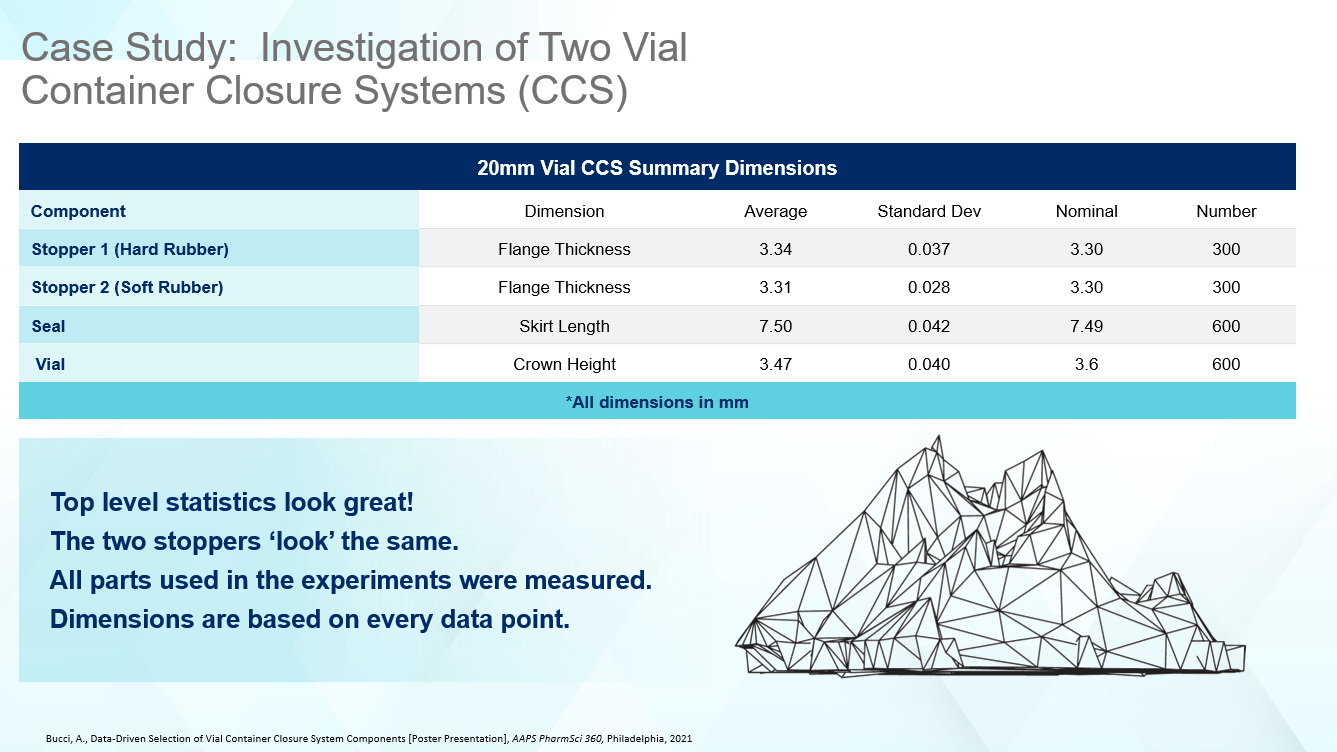
The first step to understanding the differences between the CCSs was to measure all the components. After performing a dimensional analysis, the average flange thickness dimension for each stopper was slightly different, with Stopper 2, the softer component, being closer to the nominal, as well as showing less variability according to the standard deviation. However, both rubber stoppers were close to nominal specified on the engineering drawing, and showed tight dimensional data as evidenced by the mean and standard deviation. The same types of results were observed for the seal and vial, but the vial crown height was on the small side when compared against the specifications in ISO 8362-1. Considering the top-level statistics in Figure 1 alone, one might conclude the two CCSs are interchangeable.
Figure 1
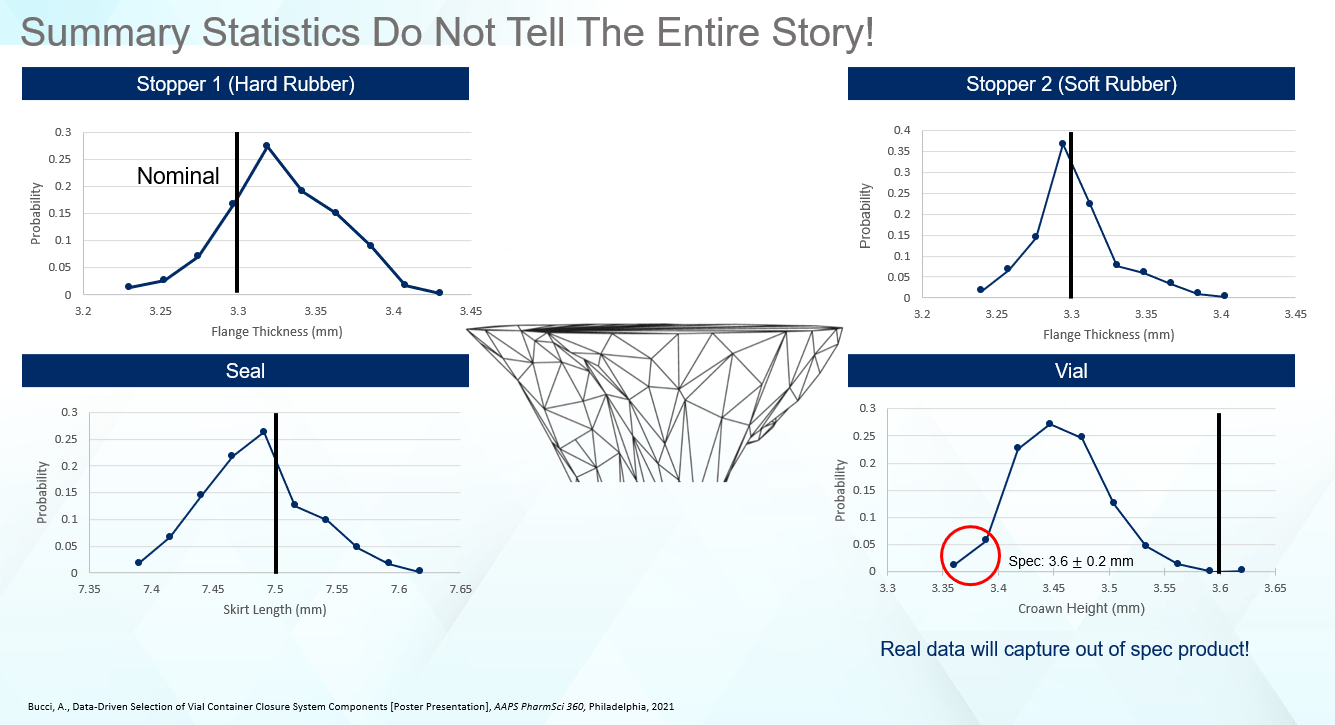
However, is it accurate to assume that summary statistics tell the entire story? To understand edge cases (components exhibiting dimensions at the extremes of the specification), how frequently they occur, or how a shoulder in the size distribution influences the final finished product, there is a need to dig deeper. As we will see, the summary statistics are the tip of iceberg, concealing significant information hidden beneath the surface. In this case, while the stoppers looked the same from a top-level perspective as seen in Figure 1, that is not the case when looking at the detailed size distributions in Figure 2.
Relative to the nominal, Stopper 1 is a little large, showing most of the data to the right of the nominal. For Stopper 2, even though the distribution is tighter, most of the data falls on the left-hand side of the nominal. Therefore, even though both stoppers are the ‘same’ when looking at the engineering drawings and top-level statistics, they are in fact quite different from a dimensional standpoint. Examining the dimensional distributions for the remaining components, the seals skew small, while the vial data falls well below the ISO 8362-1 target of 3.6mm.
Figure 2
To generate Figure 2, we were able to measure every part for the case study. However, is this necessary or could we have relied upon something like statistical sampling to achieve the same goal? Is it important to go straight to the real probability distributions of components entering a process rather than statistical understanding? Why go through the hassle of measuring so many parts? The answer comes down to two key questions. The first is what am I interested in solving. Do I need process development support, initial component evaluation, lifecycle management, or something else? Secondly, if the first answer can be framed such that the components entering a fill-finish process matter each time, as in low-volume high-value cell and gene therapies, it is essential to understand ‘What’s in the box?’. This question focuses on what enters a process each time, rather than statistical data which is only correct as the number of samples produced becomes large. In other words, do we need accuracy (statistics) or precision (‘What’s in the box?’)?
Statistical sampling is a great balance between throughput and getting the right summary data, but it is not always precise. Despite getting the ‘same’ statistics, you can receive very different answers for the dimensional distributions based on different sampling rates as seen in Figure 3.
Figure 3
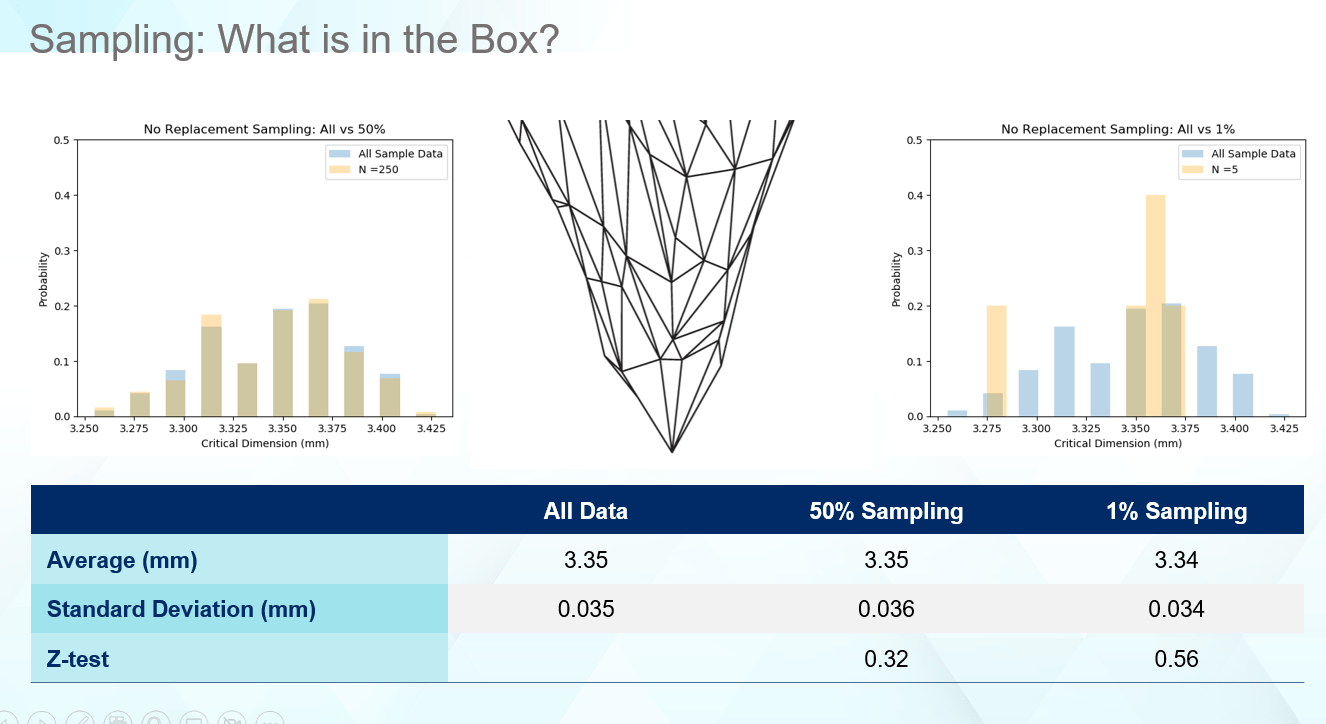
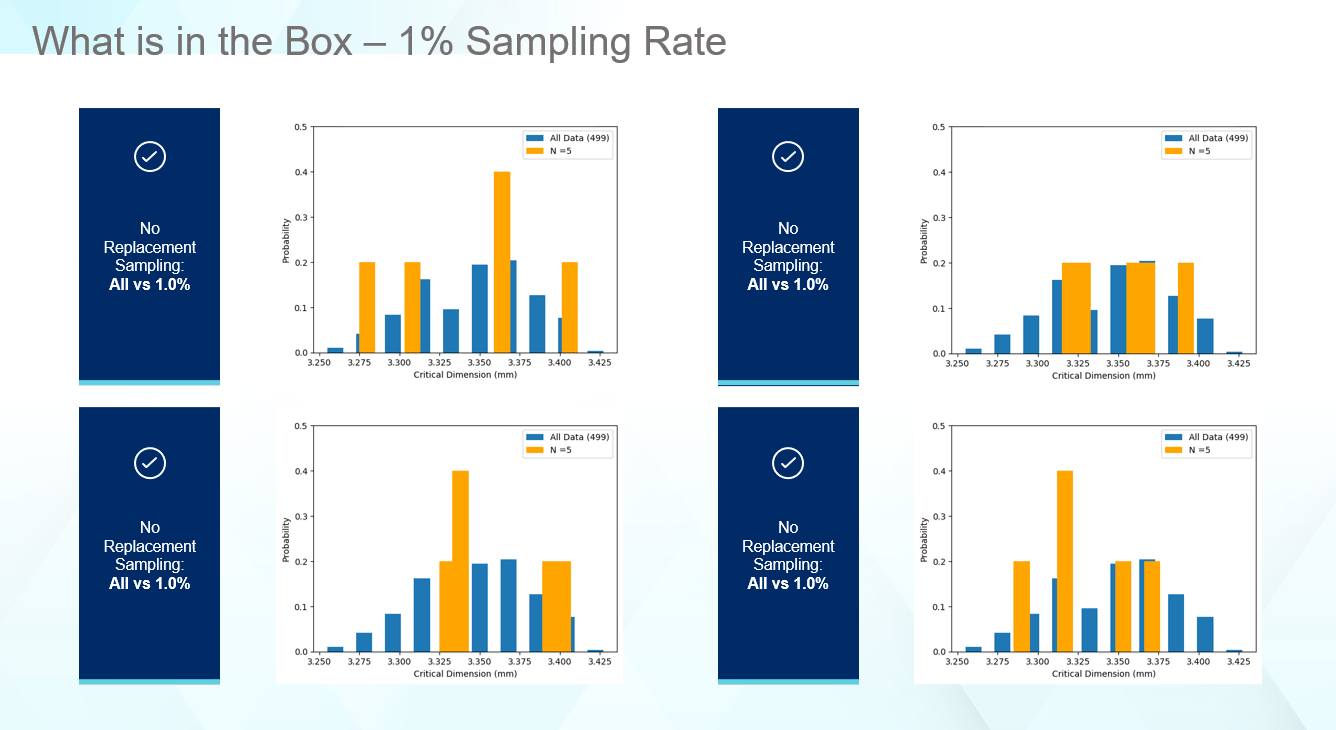
One key to making good decisions about your vial containment system, which protects the drug product, is to ensure the data being captured supports the question asked. The average and standard deviation for the listed sampling rates matches the overall average and standard deviation very well. For some drug products, this may be all that is necessary in selecting components, especially if millions of vials of drug product are produced daily. However, as seen in Figure 4, even though the statistics match well, the real data tells a different story. Figure 4 provides four cases for how a 1% sampling rate of the received components can look. In no case are the edges captured as well as the distribution illustrating the true range of values this part can display. In all cases, the computed average and standard deviation matches the full set of data like Figure 3. Thus, even though statistically everything appears normal, unexpected failure can occur in the low probability regions that the sampling rates miss.
Figure 4
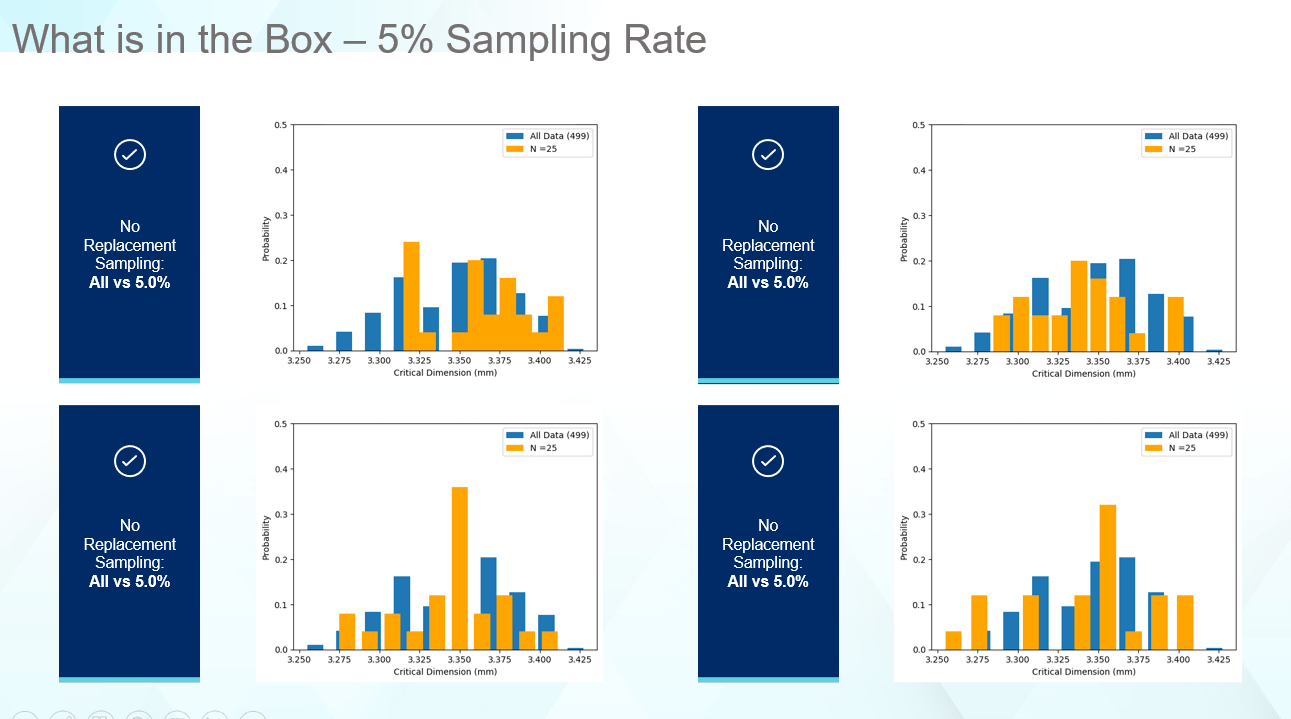
Let’s explore sampling rates in some more detail. Figure 5 shows a 5% sampling rate. The results are much better than 1%, but still failing to properly identify the correct range or the correct shape of the original data. Thus, the edge cases which may cause problems during fill-finish or container closure integrity (CCI) related issues are not captured.
Figure 5
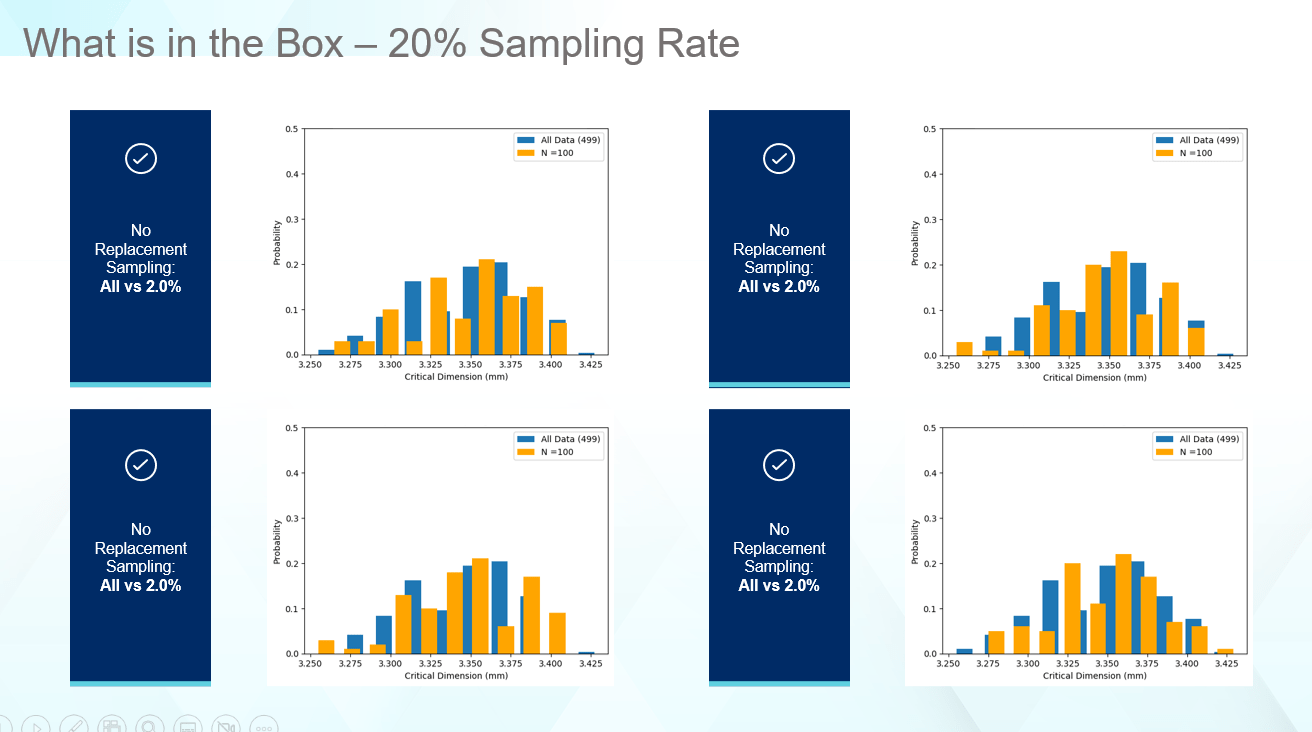
Raising the sampling rate to 20%, as shown in Figure 6, begins to match the shape of the original data, but in most cases still fails to properly identify the range. Depending on the capabilities for measuring components, this is not a bad sampling rate.
Figure 6
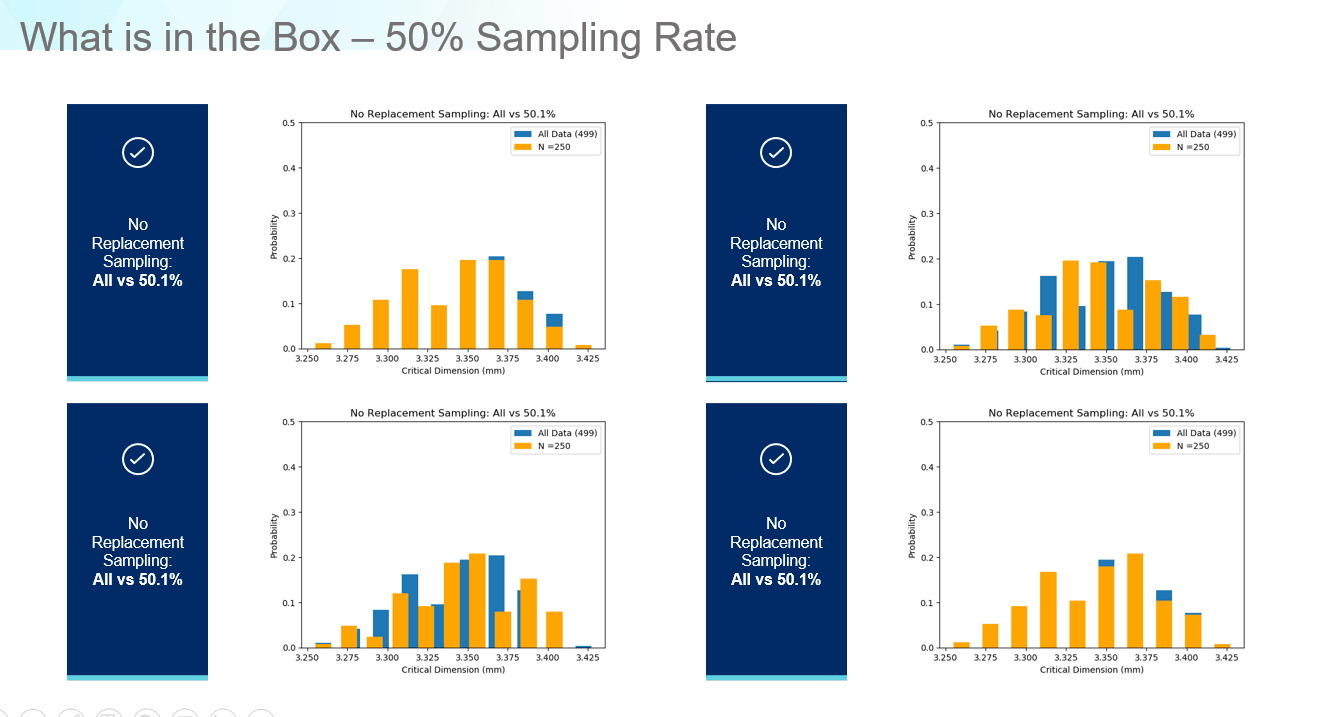
What if we examine at a sampling rate of 50%? Now the data matches the correct range and shape of the original data as shown in Figure 7. Regarding accuracy versus precision, for a new product, if we need data to develop a fill-finish process from scratch, the 1% rate might be sufficient as a first step but in the highly regulated pharmaceutical industry, it only takes a few poorly sealed vials to scrap an entire lot of drug product, or even worse, trigger a product recall. For cell and gene therapy applications, where very small batches are produced, it is even more important to ensure your fill-finish processes are as precise and consistent as possible. The only way to do this is to reconsider how we define ‘How much data is enough?’ and develop process models which can predict when issues may occur based on the parts entering the equipment rather than idealized data distributions with numerous baked in assumptions.
Figure 7
West understands the challenges of getting the right data, the right resources, and the speed needed to make good decisions on your vial containment system to protect your drug product. West developed The DeltaCube™ Modeling Platform to empower you to make data-driven decisions, enabling you to rapidly evaluate multiple CCSs at the same time, track and trend dimensional data, and import data in any amount whether you need statistical sampling data or to answer the question ‘What’s in the box?’. Through providing as much real data as possible for your system(s) and the ability to adjust for your specific fill-finish process, the DeltaCube™ Modeling Platform enables users to make more informed, accurate, and reliable decisions for vial containment systems.
Click here to learn more about the DeltaCube™ Modeling Platform and sign up for your free trial today to see the power of using real data for your vial containment systems!
West and the diamond logo and DeltaCube are trademarks or registered trademarks of West Pharmaceutical Services, Inc. in the United States and other jurisdictions.